Owners ask us some version of the same question constantly: “is my cabin doing well?” The honest answer almost always requires more context than a single number, but there are real benchmarks worth knowing before you decide whether your revenue is on track, underperforming, or actually fine.
The Headline Average, and Why It’s Nearly Useless on Its Own
Based on AirDNA market data through mid-2026 across roughly 7,000 active Gatlinburg listings, the average short-term rental generates approximately $46,400 in gross annual revenue, at an average nightly rate of $347 and average occupancy of 53% (Haven Vacation Rentals). The important caveat, stated directly in that same analysis: almost nobody actually earns exactly that number. It’s a mean across every listing in town, blending high-performing luxury lodges with underperforming properties nobody’s actively managing. Comparing your cabin to that single figure tells you almost nothing about whether you’re doing well.
Size Changes the Shape of the Numbers Entirely
Smaller cabins tend to run higher occupancy at lower nightly rates. Larger lodges run lower occupancy at much higher rates (Haven Vacation Rentals). That means a 2-bedroom cabin booking 65% of nights at $220 and an 8-bedroom lodge booking 35% of nights at $850 can both be performing exactly as they should for their category — and comparing one against the other’s raw revenue number is comparing two different businesses. The only benchmark that actually means something is comparison against similar-sized, similarly-located properties, not the market blended average.
The Market Is Maturing, Not Crashing
Recent year-over-year data shows revenue per listing down roughly 2.7%, occupancy down about 2.8%, while nightly rates actually rose around 1.7% (Haven Vacation Rentals). That combination — slightly lower occupancy, slightly higher rates, modestly lower total revenue — is the signature of a market that’s getting more competitive and more saturated with listings, not one that’s collapsing. Owners who are pricing and marketing passively are the ones most likely to feel this shift as a real decline. Owners who are actively adjusting tend to hold their ground.
Seasonality Here Follows a Predictable Shape
Smoky Mountain occupancy runs in a fairly consistent annual cycle year over year: a strong spring break period, a powerful summer season, a fall-foliage peak, and steadier but real winter weekend demand (The Short Term Shop). Mid-sized cabins, generally 2–4 bedrooms, tend to show the most consistent occupancy across that cycle, which is part of why they’re often considered the more stable investment category compared to very small or very large properties. If your cabin is a different size class, your seasonal curve is going to look different too, and that’s normal.
THE COMPARISON THAT ACTUALLY MATTERS
Don’t ask “how does my cabin compare to the Gatlinburg average.” Ask “how does my cabin compare to similar cabins — same bedroom count, same general area, same amenity tier — over the same 12-month window.” That’s the number that tells you whether your pricing, photos, and listing quality are pulling their weight, or whether the market alone is doing the work.
Gross Revenue Isn’t the Same as What You Keep
Headline revenue figures like the $46,400 average also don’t account for platform fees, cleaning and turnover costs, management fees, utilities, and maintenance — all of which vary significantly depending on how the property is run. A cabin generating $50,000 in gross bookings with poor cost control can net less to the owner than a $40,000 cabin run efficiently. When you’re evaluating “is my cabin doing well,” net revenue after real operating costs is a far more honest number than the gross figure that shows up in most market reports.
Three Cabins, Three Different Right Answers
Consider three hypothetical Smoky Mountain cabins: a 2-bedroom couples’ retreat, a 4-bedroom family cabin, and an 8-bedroom group lodge. All three can be performing well simultaneously while showing completely different occupancy and rate numbers — the 2-bedroom running high occupancy at a modest rate, the 8-bedroom running lower occupancy at a premium rate for large groups, and the 4-bedroom landing somewhere in between with the steadiest year-round demand. None of these is “better” in the abstract. Each is a different business with a different realistic benchmark.
What a Below-Benchmark Number Actually Means
If your cabin is underperforming its realistic comparison set, the cause is almost always one of a small number of things: stale pricing that isn’t adjusting through the seasonal curve described above, a listing that hasn’t been refreshed with current photos and description, single-channel distribution missing a meaningful share of demand, or a permit/compliance gap limiting your ability to be found or booked. None of these are usually about the market being bad. They’re usually about specific, fixable gaps in how the listing is being run.
Getting a Real Read on Your Own Numbers
Market-wide averages are a starting point, not a verdict. If you want to know where your specific cabin actually sits against realistic comparisons — not the blended town-wide average — that’s exactly the kind of thing our listing audit is built to surface, alongside a plain read on what’s working and what isn’t in your current setup.
Get My Listing Audit →
It’s $9.99, takes us a real look at your title, photos, pricing, and description, and tells you plainly where your listing stands.
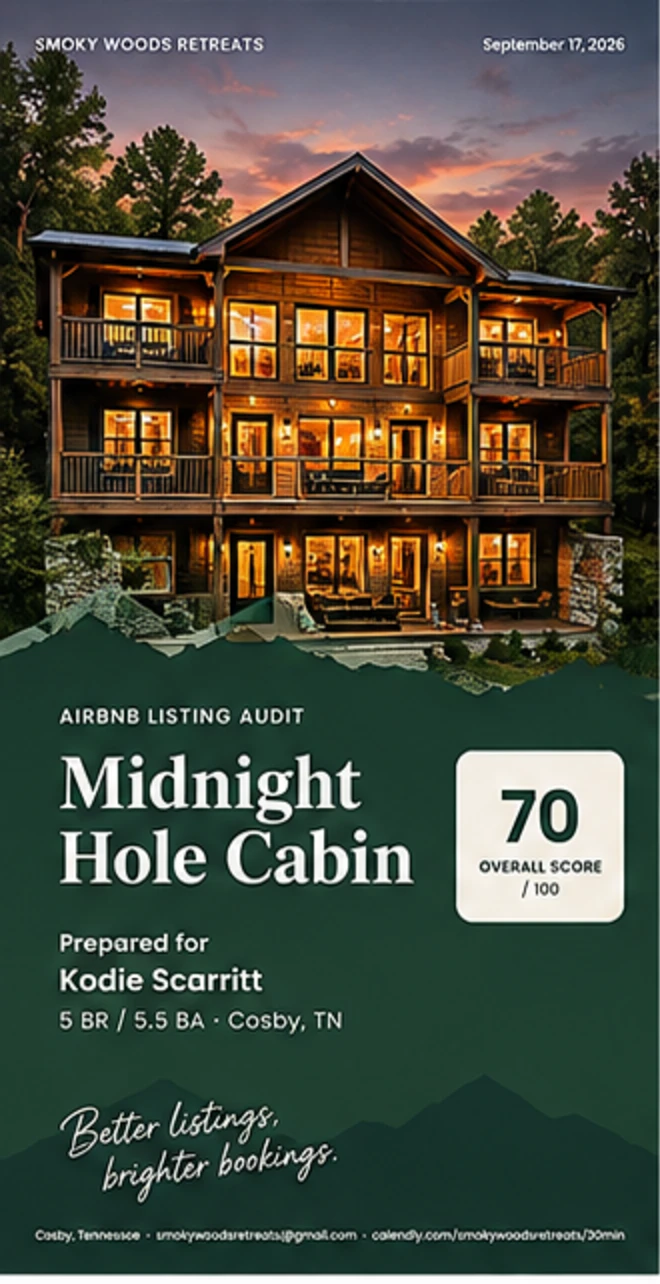 Sample audit — 8 pages, in your inbox within 24 hours